

AI Assistant Chat Interface
The AI Assistant is an in-platform chat tool that answers questions about your connected knowledge base. Ask in natural language and get structured, sourced answers without leaving the Control Center.Interface Layout
The chat interface has three main areas:- Response panel — The AI’s answers, formatted with numbered steps, bold key terms, and inline code where applicable.
- Sources bar — Indicates how many knowledge sources were referenced for the response.
- Message input — Where you type questions and configure response settings.
Reading Responses
Responses are formatted for clarity and may include:- Numbered steps for sequential or multi-part processes.
- Bold terms at the start of each step to highlight key concepts.
- Inline code for exact values, commands, or parameters that should be used verbatim.
- Italic notes at the end of a response to flag gaps or limitations in the available knowledge base.
- Action — A plain-language explanation of what happens in this step.
- Action — Further detail, including any relevant technical specifics.
If the connected knowledge base does not fully cover a topic, the assistant says so explicitly and indicates where additional detail may be needed.
Sources
At the bottom of each response, a Sources bar shows how many documents were referenced (e.g.,Sources (6)).
- Click the Sources bar to expand and view the individual documents consulted.
- A higher source count generally means the answer is supported by a broader range of material.
Message Input
The input bar at the bottom of the screen is where you interact with the assistant. Toolbar icons:
Persona selector: The None dropdown to the right of the toolbar lets you pick a persona, which adjusts the assistant’s tone or role. Defaults to None (standard assistant behavior). See Personas.
Send: Click the arrow (↑) button or press Enter to submit your message.
Settings and Modes
Two toggles appear in the bottom bar:Tips for best results
- Ask specific questions. The more precise your query, the more targeted the response.
- Check the Sources count. A higher source count generally means a more comprehensive answer.
- Read italic notes carefully. They indicate gaps in the knowledge base where you may need additional resources.
- Use Doc mode when you want responses formatted for documentation or knowledge-base use.
Limitations
- The assistant’s answers are only as complete as the knowledge base it has been trained on. If a detail isn’t covered, the assistant says so explicitly.
- The assistant cannot take actions on your behalf — it provides information only.
Quick Reference
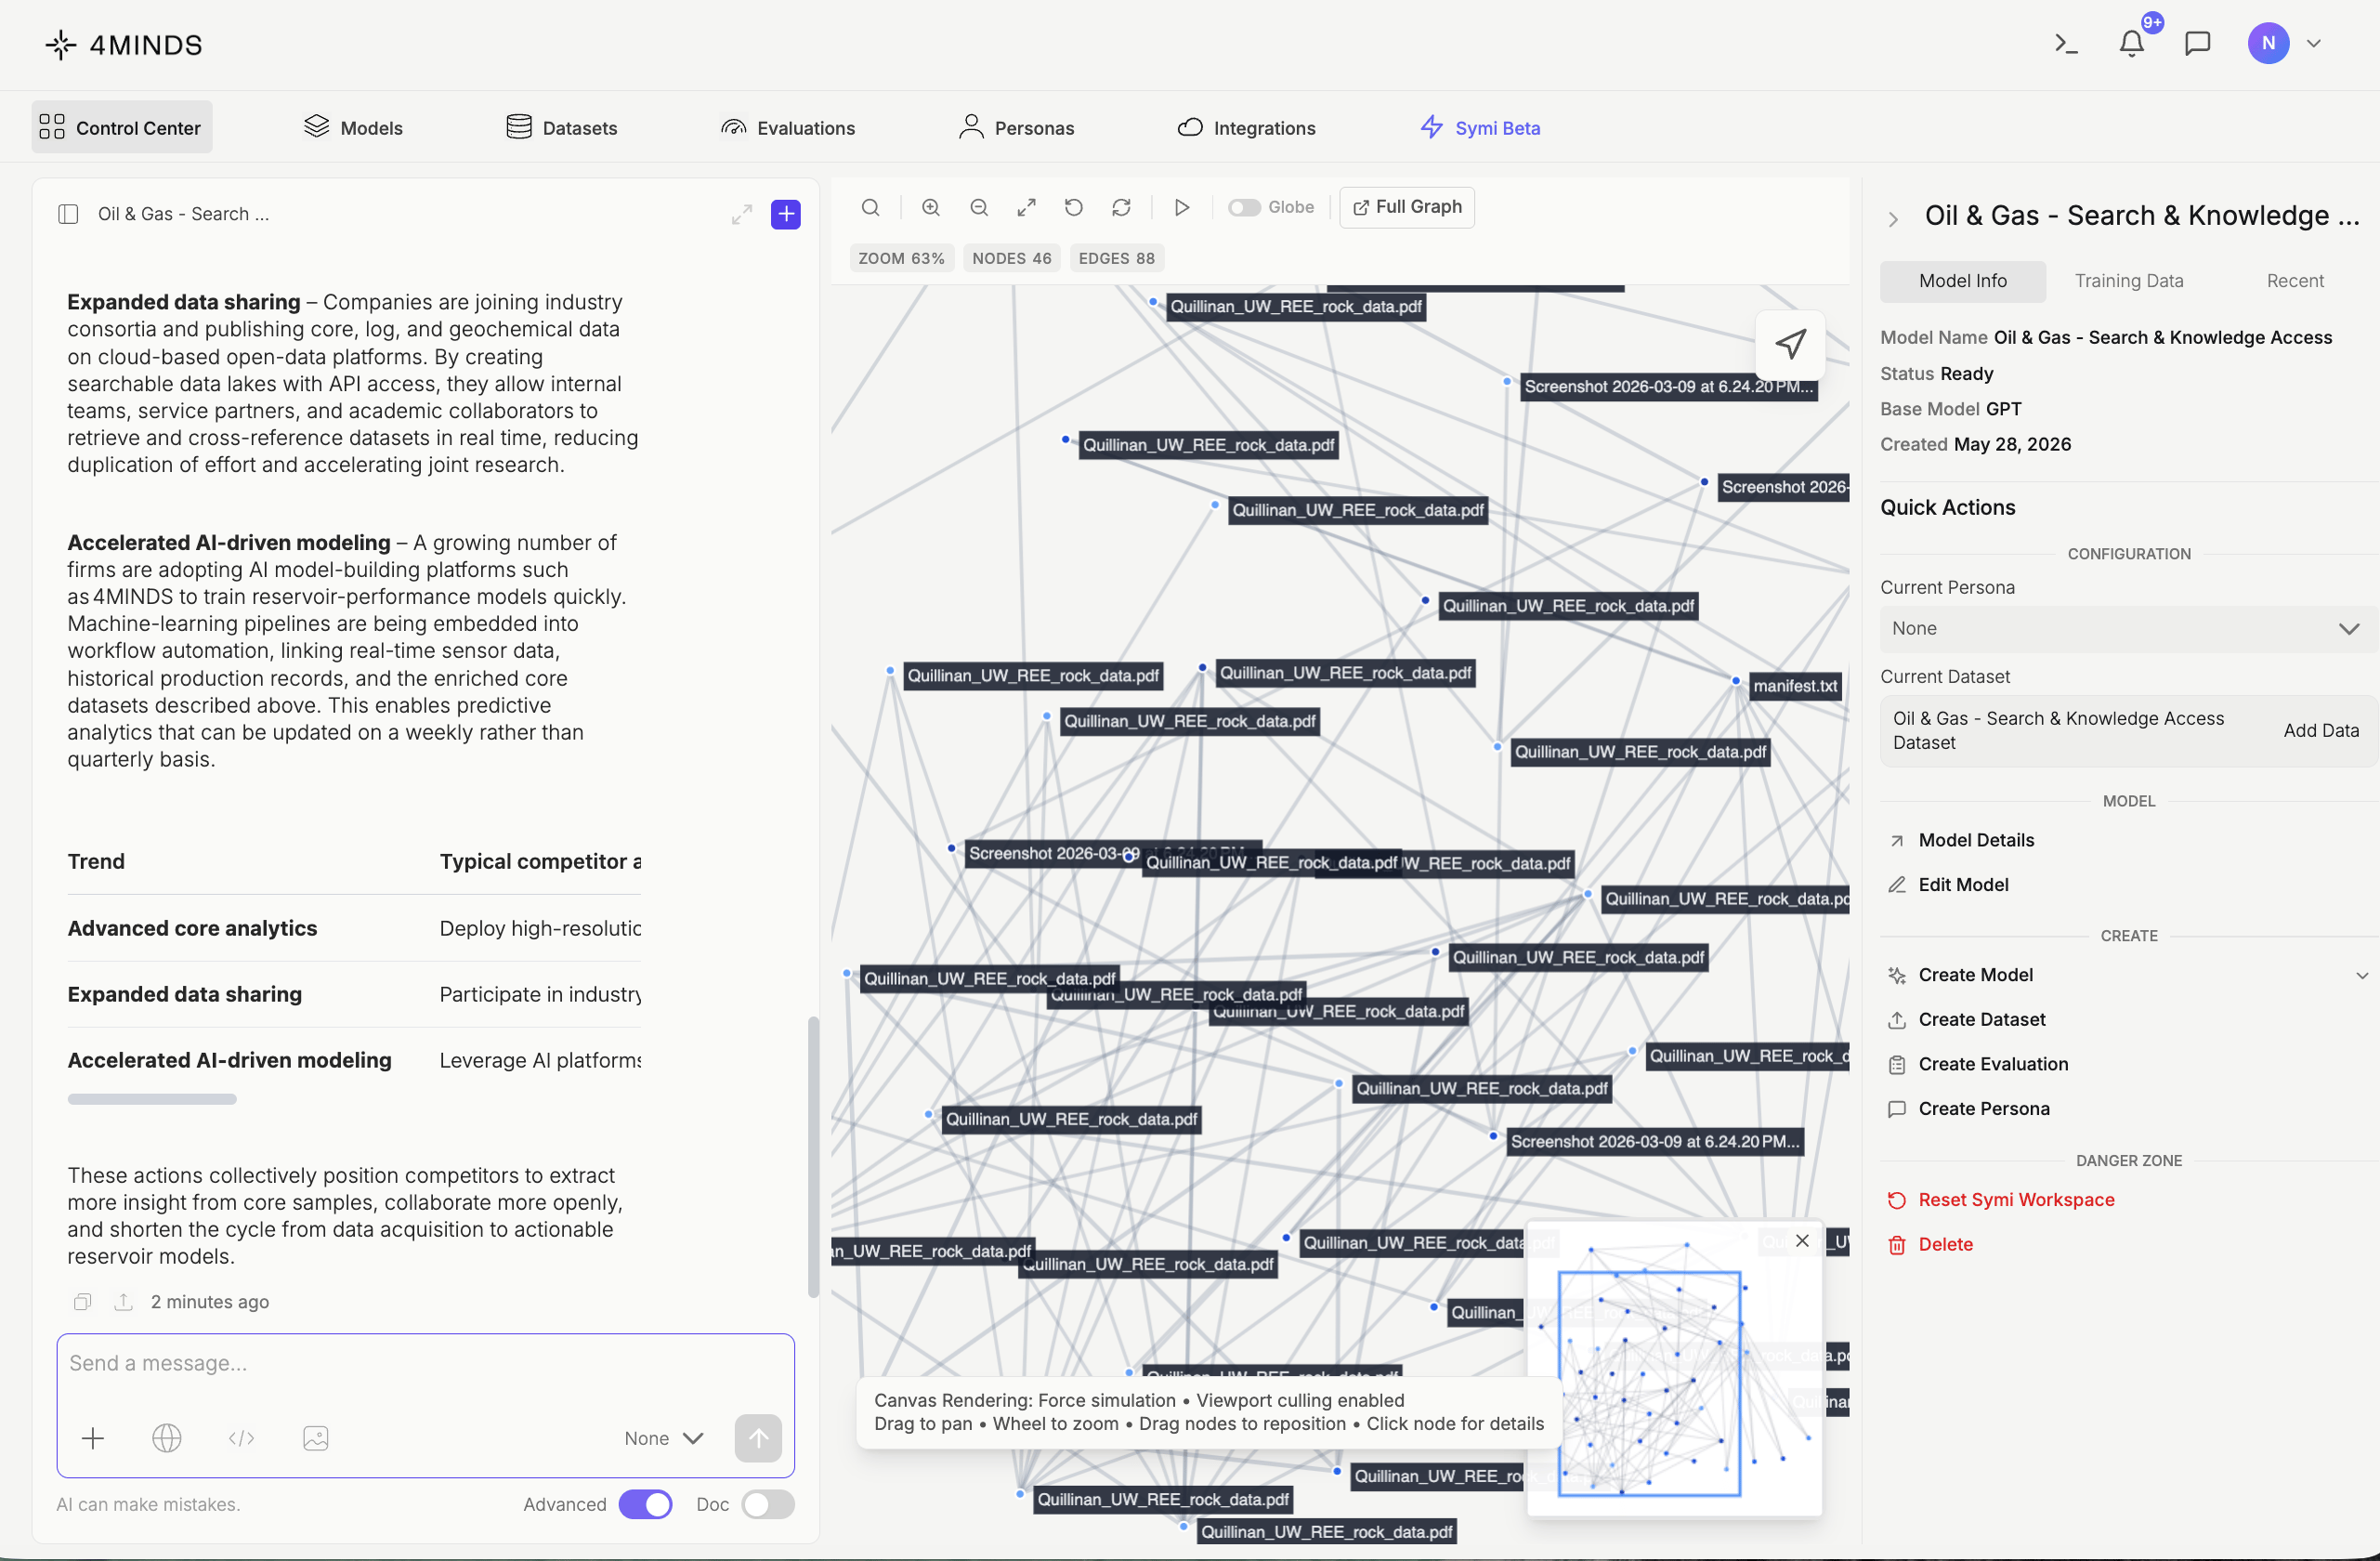
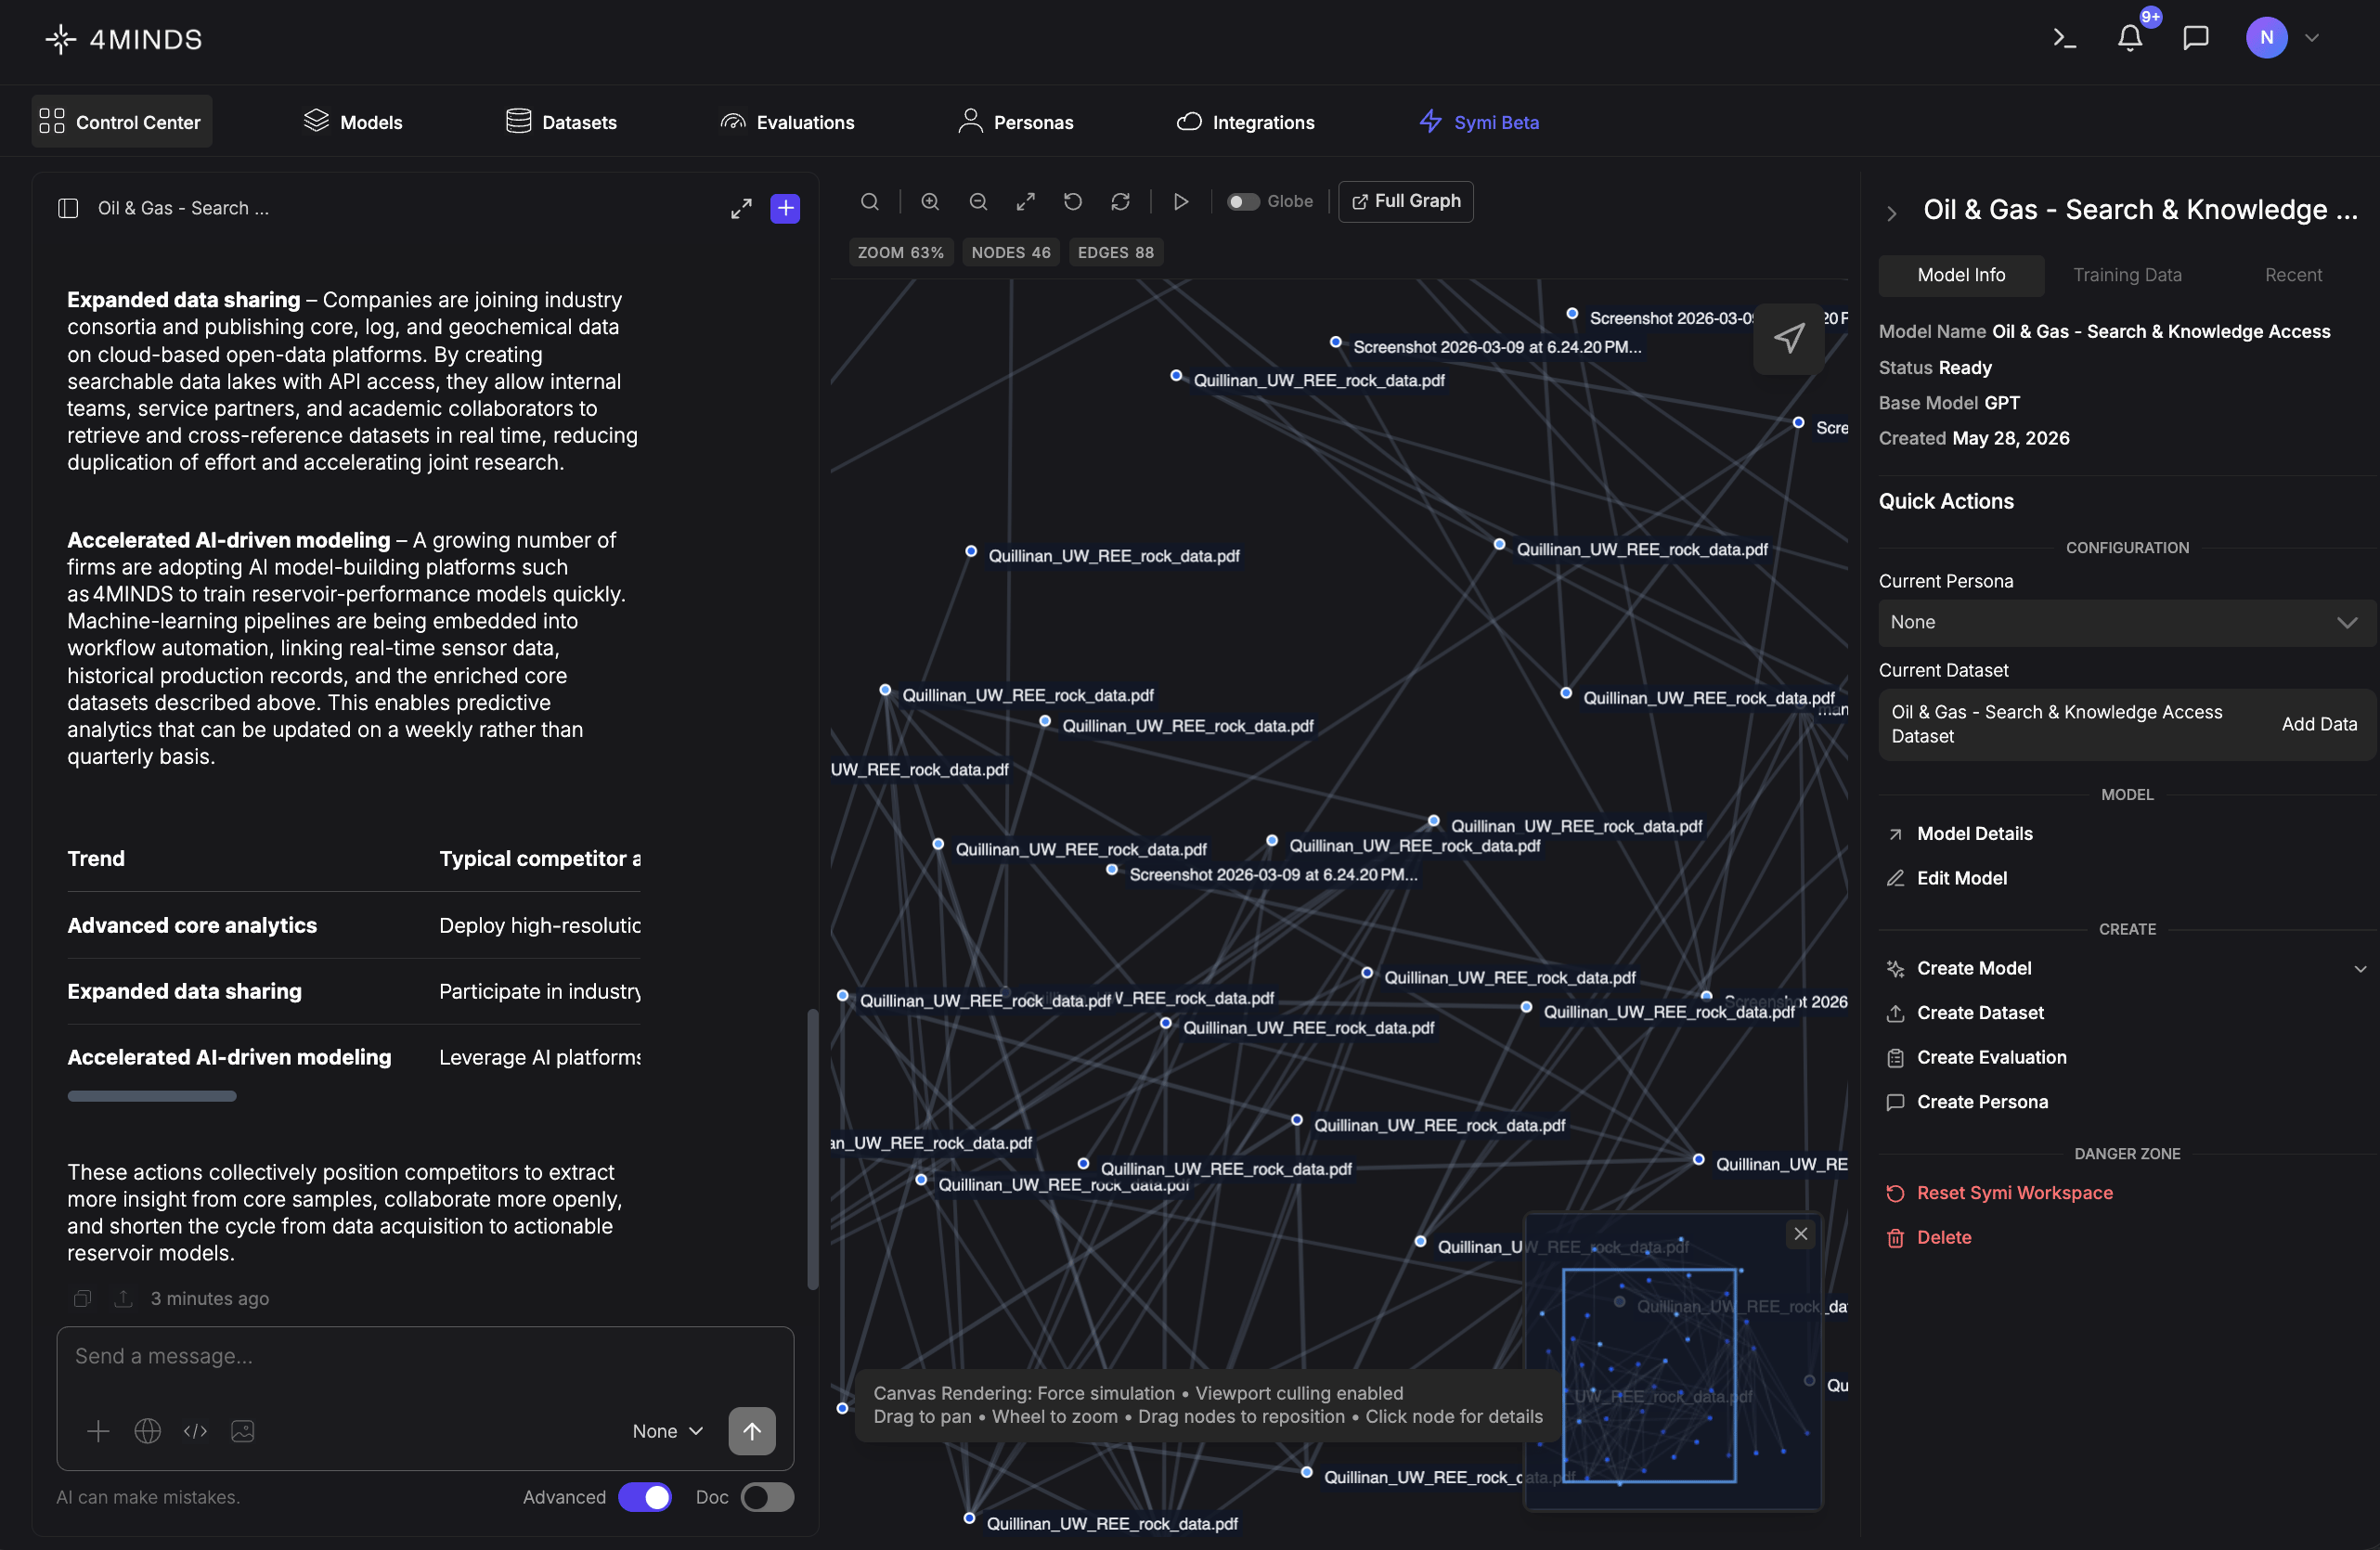
Exploring Your Data with the Graph View
The Graph view helps you visualize how different pieces of information in your dataset connect to each other. Think of it as a map showing relationships between concepts.What You’ll See in the Graph
- Blue dots (nodes): Each dot represents a piece of information or concept. Each node can represent a document, concept, extracted entity, or data point.
- Connecting lines (edges): Lines connecting dots show how concepts relate to each other. Edges indicate semantic similarity, direct references, shared attributes, or contextual connections.
- Clusters: A cluster is a group of closely connected nodes that represent related topics.
- Peripheral nodes: Peripheral nodes are ideas that sit on the edges of the network with fewer relationships.
Interpreting Your Graph
The information bar displays key metrics:- Nodes: Total number of entities (e.g., “Nodes: 16”)
- Edges: Total number of connections (e.g., “Edges: 61”)
- Matches: Number of nodes that meet the current filter or selection criteria (e.g., “Matches: 34”)
- Zoom: Current zoom level (e.g., “86%“)
Graph View Controls
- Pan tool
- Zoom in/out controls
- Fit to screen
- Reset view
- Pause/play simulation
- Globe View toggle (2D/3D)
Node Search
Search functionality helps you quickly locate specific nodes within your graph:- Search by node label: Find nodes by their display name (e.g., “CustomerFeedback”)
- Search by content keywords: Locate nodes containing specific keywords within their content
- Search by unique node ID: Navigate directly to a node using its identifier (e.g., “65b1143b-8…”)
- Matching results highlight: Search results are highlighted in the graph for easy identification
- Navigate to results: Press Enter or click a search result to navigate directly to that node
Node Search Filters
Options Filter- Quick Jump toggle: When enabled, automatically focuses on the first matching node in real-time as you type your search query
Mini-Map
Located in the bottom right corner, the mini-map provides an overview of your entire graph structure. A blue square indicates your current viewport position within the larger graph. Click anywhere on the mini-map to quickly navigate to that area. The mini-map is collapsible - use the close button (×) to dismiss it when not needed. This feature is essential for navigating large, complex graphs efficiently.Workspace Model Manager
The Workspace Model Manager is the sidebar panel on the right of the Control Center. It groups everything you need to build, configure, and manage a model alongside its dataset and persona. The panel is organized into three tabs — Model Info, Training Data, and Recent — plus a persistent Quick Actions panel below them.The Workspace Model Manager is available on every tab in the platform. It stays docked alongside whatever you’re viewing, so you can switch tabs, manage models, and trigger Quick Actions without losing context. If you don’t need it visible, toggle the panel closed at any time and reopen it when needed.
Model Info tab
The default view. Displays core details about the currently active model:
A status of Ready means the model is fully configured and available for use.
Direct base-model selection has been deprecated. Models deployed directly on the 4MINDS platform now run on
gpt-oss-120b. To use other foundation models (Claude, Gemini, Llama, Mistral, etc.), connect them through an external provider integration like Amazon Bedrock, Google Vertex AI, Amazon SageMaker, or Microsoft Foundry.Training Data tab
Lists every document currently loaded into the model’s dataset. These files form the knowledge base the model draws on when responding to queries. Supported formats include.txt, .pdf, .png, and others — see Manage your Datasets for the full list.
To add new files, use Add Data in the Current Dataset card of the Quick Actions panel.
Recent tab
Shows the most recently accessed models in your workspace. Each entry displays the model name, a short description, and its current status. The active model is marked with an OPEN badge. Click any other entry to switch to it.Quick Actions panel
The Quick Actions panel is persistent across all three tabs and provides shortcuts for configuration and management tasks. It’s divided into four sections: Configuration, Model, Create, and Danger Zone.Configuration
- Current Persona — Assigns a persona to shape the model’s tone and communication style. Defaults to None. Use the dropdown to select from available personas. See Personas.
- Current Dataset — Shows the dataset currently linked to the model. Click Add Data to upload additional files and expand the model’s knowledge base.